Timing Diagram Drawing Techniques
Drawing Waveforms
Signals are waveforms that represent a single digital input or output. There are essentially 7 standard waveform states. High, Low and tri-state (a line drawn in the middle) are the common states for single bit values. Valid, invalid, and tri-state are used to show bus values (multi-bit values), where the valid state is a bubble and invalid state is a grayed bubble. Less common states are weak high and weak low states (indicated by dotted high or dotted low lines) which are used to indicate signals that are weakly pulled to a high or low state by a resistive pullup or pulldown.
Timing diagrams can be drawn by hand on graphing paper or using a timing diagram editing program. If you are drawing by hand, make sure to use a pencil and draw lightly, because you will be making a lot of changes as you learn about the timing of your design. When using a timing diagram editing program, you will typically draw the waveforms using the mouse. Timing diagram editors will automatically draw clock signals from basic timing information like such as the clock's frequency and duty cycle.
Timing Parameter Analysis: Delays, Setups, and Holds
The true power of a timing diagram comes from the ability to relate different signal transitions through timing parameters. Delays, setups, and holds are the three basic types of timing parameters. Other commonly used timing parameter types such as pulse width requirements can also be modeled using these three basic types.
A delay between two signal transitions will force the transitions to be a specified distance in time from each other. This keeps the designer from having to manually place signal transitions at exact times. For example, to make two signal transitions exactly 15ns apart: roughly sketch the waveforms and add a delay parameter between two signal transitions using the right mouse button. Next type 15 into the min or max column of the delay in the spreadsheet. The second signal will move so that it is exactly 15 ns from the first signal transition. Now that the two signal transitions are related, if either is moved then the other will follow in order to keep the correct timing. This is how changes in timing are propagated through the diagram.

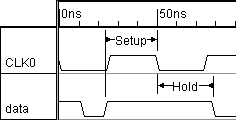
Setups and holds are timing requirements that must be met by a design in order for the system to function properly. A setup time monitors a transition on a data signal before a control signal transition (e.g. system clock transition). A hold monitors a transition on a data signal after a control signal transition. The distance between the control and data transitions minus the hold or setup time is the safety margin or margin of the timing parameter. The WaveFormer automatically calculates the margin times for setups and holds and displays them in the parameter spreadsheet so that the designer can determine how much further the timing of the circuit can be adjusted. If a timing change causes a setup or hold time to be violated, the margin of the violated setup or hold will be shown in red. All margins are recalculated whenever there is a timing change. This automatic recalculation of timing requirements makes it easy for designers to weigh the tradeoffs of different design choices.
